
Custom Dashboards
Open Dashboard Builder in Samurai to build a dashboard, or Custom Dashboards to view published dashboards.
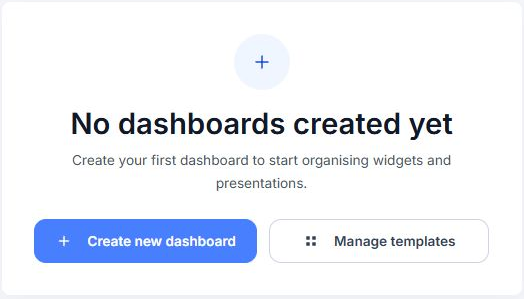
Dashboard Builder is empty in this example. If you see this screen, select Create new dashboard to begin.
This guide is for people who build and publish Dashboards in Samurai CMMS. Use the Quick Guide to get started, then the Data Dictionary to see what each dataset can show.
Every dataset exists in three forms that share the same data: a Base Report on the Reports page, a Data Tables widget in the widget picker, and the charts drawn from that widget. Columns, labels, filters and groupings come from the Base Report, so a widget matches its report for the same user, filters and period, apart from any differences listed in a dataset's Business rules.
| Term | Meaning |
|---|---|
| Dashboard | A page of widgets that you build, save and publish. |
| Widget | One tile on a Dashboard. It reads one dataset and shows it one way. |
| Dataset | The records behind a widget and its Base Report, such as Work Orders. |
| Presentation | How a widget shows its data: Table, Metric Tile or a chart type. |
| Measure | The number a chart or Metric Tile plots, such as Total Actual Cost. |
| Group By | The field that splits records into groups. |
| Group Mode | Detail shows individual records. Consolidated shows one total per group. |
Field labels can differ slightly between tenancies, because labels come from your own Base Report definitions.
In this section
- Quick Guide: create, edit, publish and delete a Dashboard
- Widget and Chart Options: chart types, settings, periods, limits and filters
- Data Dictionary: the fields, measures, filters and rules of each dataset